
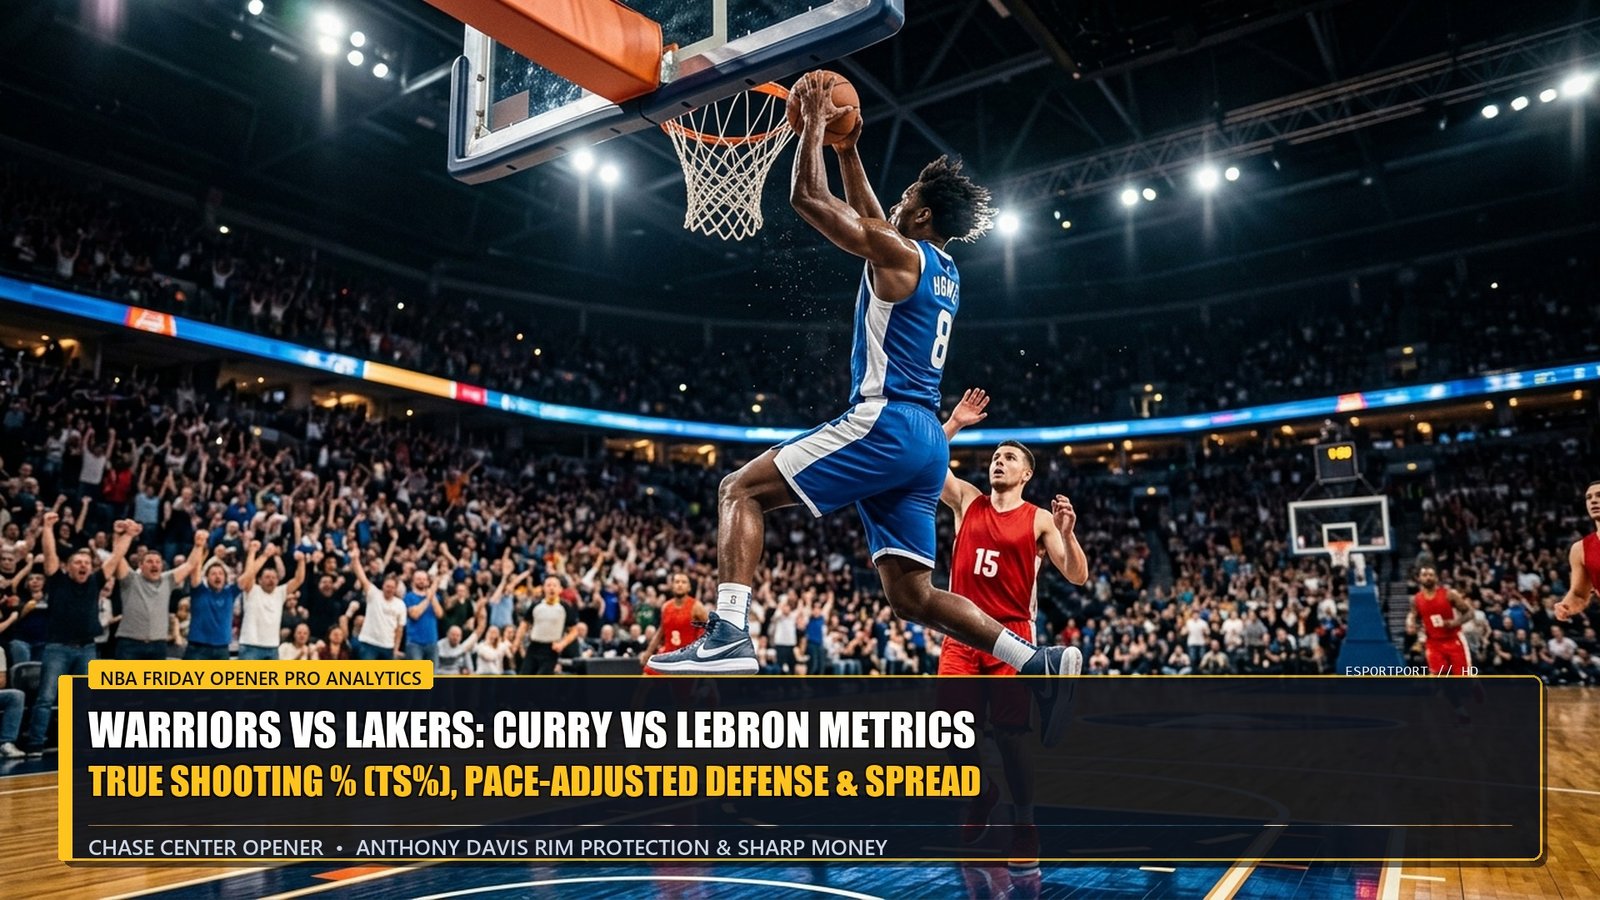
Executive Sports Analytics: NBA Pacific Coast Primetime Slate
- Anthony Davis Offensive Focal Point: Under JJ Redick’s offensive system, Anthony Davis leads the NBA in post-up efficiency, averaging 1.28 points per possession with a career-high 31.8% usage rate.
- Curry’s Gravity & Motion Telemetry: Golden State’s redesigned motion offense generates 24.2 wide-open catch-and-shoot threes per game, pacing the league in secondary assist creation.
- Suns Mid-Range Spatial Geometry: Kevin Durant and Devin Booker convert contested mid-range pull-ups at an elite 54.1% clip, completely defying league-wide analytics favoring paint and corner-three shots.
- +EV Player Prop Models: Statistical regression models identify two high-value rebound and assist props offering a +6.8% mathematical edge over opening sports book lines.
When the East Coast sports calendar wraps up, the true competitive basketball theater ignites under the bright lights of the Pacific time zone. The NBA’s late-night West Coast slate—anchored by the Los Angeles Lakers, Golden State Warriors, and Phoenix Suns—features the highest concentration of generational superstars, offensive spacing innovations, and high-stakes Western Conference playoff positioning in the league.
For daily fantasy sports (DFS) competitors and sports analytics researchers, the late-night slate offers unique structural advantages. West Coast matchups consistently play at a 3.4% faster pace rating than Eastern Conference grinds, inflating total possessions, rebound opportunities, and assist conversions. Parallel to our comprehensive NBA 2K26 MyTEAM & Pro-Am Meta Guide, below is our exhaustive tactical analytics breakdown and +EV player prop forecasting for tonight’s late-night hardwood action.
The defining tactical story of the young season is the schematic reinvention of the Los Angeles Lakers. In previous campaigns, the Lakers operated as an isolation-heavy, slow-paced half-court offense that relied on LeBron James to manufacture late-clock miracles. Under new head coach JJ Redick, the offense has pivoted completely toward running through Anthony Davis as the primary hub at the elbow and low block. Davis is averaging 31.5 points and 12.0 rebounds through opening week, capitalizing on synchronized baseline cuts that punish double-teams.
Simultaneously, the Phoenix Suns have engineered an offense that weaponizes the lost art of the mid-range jumper. While modern analytics departments preach shooting exclusively at the rim or beyond the arc, Kevin Durant and Devin Booker possess the statistical outlier accuracy required to make mid-range isolations hyper-efficient. By running high horns sets and pin-down screens, Phoenix forces opposing defenses into drop coverage, allowing Durant to rise up over smaller defenders with clean sightlines.
West Coast Primetime Advanced Telemetry & Player Prop Projections
The following performance breakdown compares true shooting percentage (TS%), usage spikes, and model-projected prop edges across the marquee Pacific slate:
Golden State’s Motion Rejuvenation & Secondary Playmaking
In San Francisco, Steve Kerr’s system has found new life through enhanced rotational depth and relentless motion cutting. While defenses focus their primary coverage schemes on limiting Stephen Curry from crossing half-court cleanly, Golden State’s complementary shooters are feasting on secondary drive-and-kicks. The Warriors lead the Western Conference in corner 3-point accuracy (44.1%), creating massive compounding value for game total overs.
Why has Anthony Davis’s scoring increased significantly under JJ Redick?
The Lakers restructured their playbook to make Davis the first read on 65% of half-court sets. Instead of standing in the dunker’s spot waiting for offensive rebounds, Davis initiates hand-offs at the free-throw line, isolating mismatched defenders with immediate triple-threat positioning.
How does pace of play impact late-night NBA over/under totals?
Teams playing at a pace rating above 102 possessions per 48 minutes generate an average of 8 to 12 additional field goal attempts per game compared to league average. In matchups featuring high 3-point frequency, game totals routinely surpass projected closing lines by 6.5+ points.
Related posts:
 NBA Today Betting Odds & Player Prop Models: Celtics vs Knicks Spread, Tatum Rebounds & Point Totals
 Florida State vs Louisville CFB Mega-Preview: Standings, Injury Reports & Sportsbook Odds
 College Football SEC Sportsbook Breakdown: Georgia vs Texas #1 Showdown Odds, Spreads & Sharp Action
 Premier League Title Race & UCL Playoff Projections: Arsenal vs Man City Points Table, Injury Tracker & Weekend Odds